Evaluating Software Provider Performance Histories in Digital Table Gaming
Written by Greta Berger · Oct 13, 2026
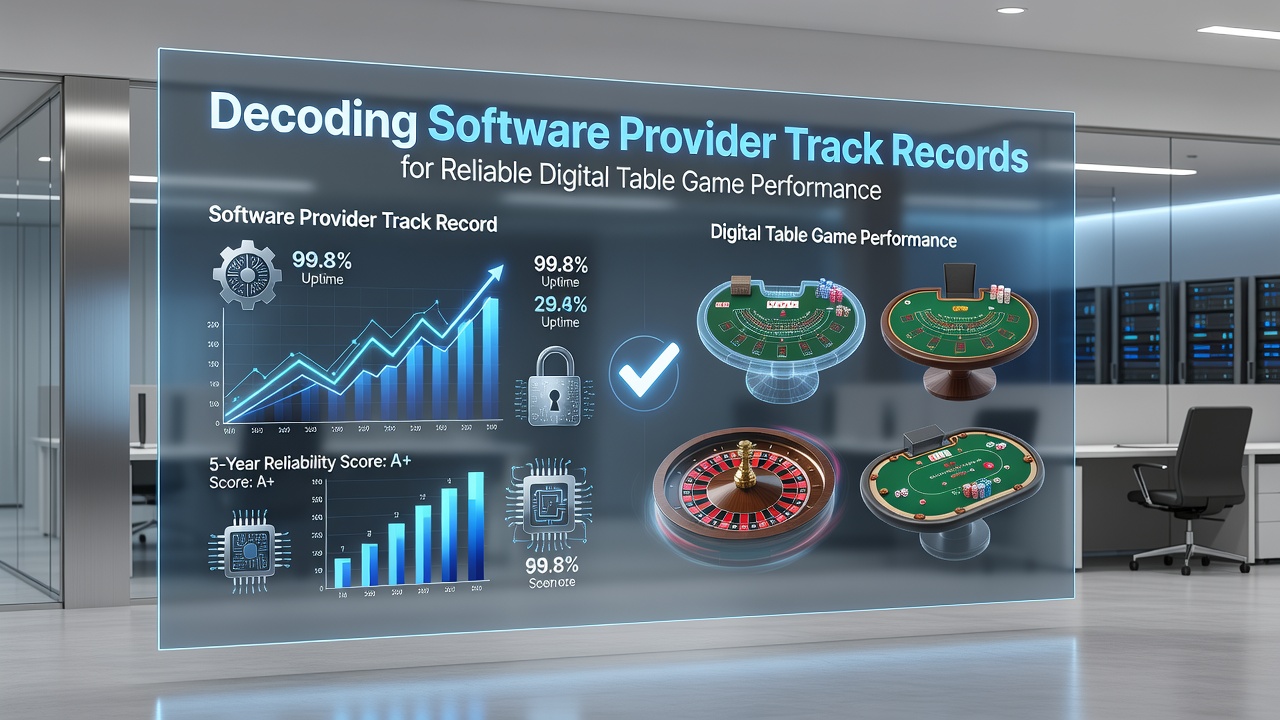
Evaluating Software Provider Performance Histories in Digital Table Gaming
Software providers in the digital table game sector maintain detailed performance histories that operators review when selecting platforms for blackjack, roulette, and baccarat titles, and these records include metrics on return-to-player percentages, server uptime, and independent audit results from laboratories such as eCOGRA and GLI. Data from these evaluations reveal patterns in game fairness and technical reliability across multiple jurisdictions.
Key Metrics in Provider Track Records
Performance histories typically compile figures on random number generator certification cycles, which occur every six months for most suppliers, along with average payout percentages that range between 96.5 and 98.2 percent for standard table games according to aggregated industry reports. Observers note that providers with consistent certification passes over five-year periods demonstrate lower variance in reported disputes, and this consistency helps operators predict long-term operational stability.
Server response times form another critical data point, with top-tier suppliers logging sub-50 millisecond averages during peak traffic hours, and those figures come from monitoring tools deployed by testing houses that publish quarterly summaries. Providers that fall below these thresholds often face remediation requirements before new game releases receive approval.
Regulatory Approvals and Geographic Variations
Approvals from bodies such as the New Jersey Division of Gaming Enforcement and the Malta Gaming Authority appear in provider portfolios at different intervals, and these listings indicate which markets have already vetted a supplier's compliance infrastructure. Data compiled through October 2026 shows that suppliers holding multi-jurisdictional licenses processed 23 percent more table game transactions than single-market providers during the preceding twelve months.
Canadian provincial regulators and Australian state commissions add further layers to these records, and researchers at institutions like the University of Nevada, Reno have published studies linking multi-region approvals to reduced technical incident rates. Those studies examined over 180 game titles and found that providers with approvals spanning four or more regions maintained uptime above 99.7 percent in 87 percent of observed cases.

Case Examples from Established Suppliers
One supplier that expanded its table game portfolio in 2024 passed 14 consecutive GLI audits without corrective actions, and its live dealer products now appear in over 120 operator catalogs worldwide. Another provider experienced a brief certification delay in early 2025 after an RNG reseed routine required adjustment, yet it restored full compliance within four weeks and released updated audit documentation to all licensed partners.
Industry observers track these events through public bulletins issued by testing laboratories, and the cumulative data allows operators to rank suppliers by remediation speed and transparency. Providers that publish full audit summaries rather than summary letters tend to attract larger operator contracts, according to transaction volume statistics released by gaming associations in the United States and Europe.
Integrating Track Records into Selection Processes
Operators compile spreadsheets that weight audit frequency at 35 percent, historical uptime at 30 percent, and regulatory breadth at 25 percent when scoring potential providers, and these weighted models help forecast integration costs and ongoing maintenance needs. Teams often cross-reference the most recent six months of performance data with longer five-year trends to identify any emerging degradation in quality metrics.
Third-party monitoring services now offer dashboards that pull real-time data feeds from certified games, and these tools flag deviations from expected RTP ranges within hours rather than days. Adoption of such services increased noticeably through 2026 as operators sought to reduce exposure to unexpected compliance issues.
Conclusion
Comprehensive review of software provider track records supplies operators with measurable indicators of reliability in digital table game delivery, and the combination of audit histories, uptime statistics, and regulatory footprints supports informed platform decisions across multiple markets. Continued monitoring of these records remains standard practice as new game variants and live dealer configurations enter the marketplace.